Carbon Arc
From audience data to campaigns across ad platforms.
One workflow across ad systems
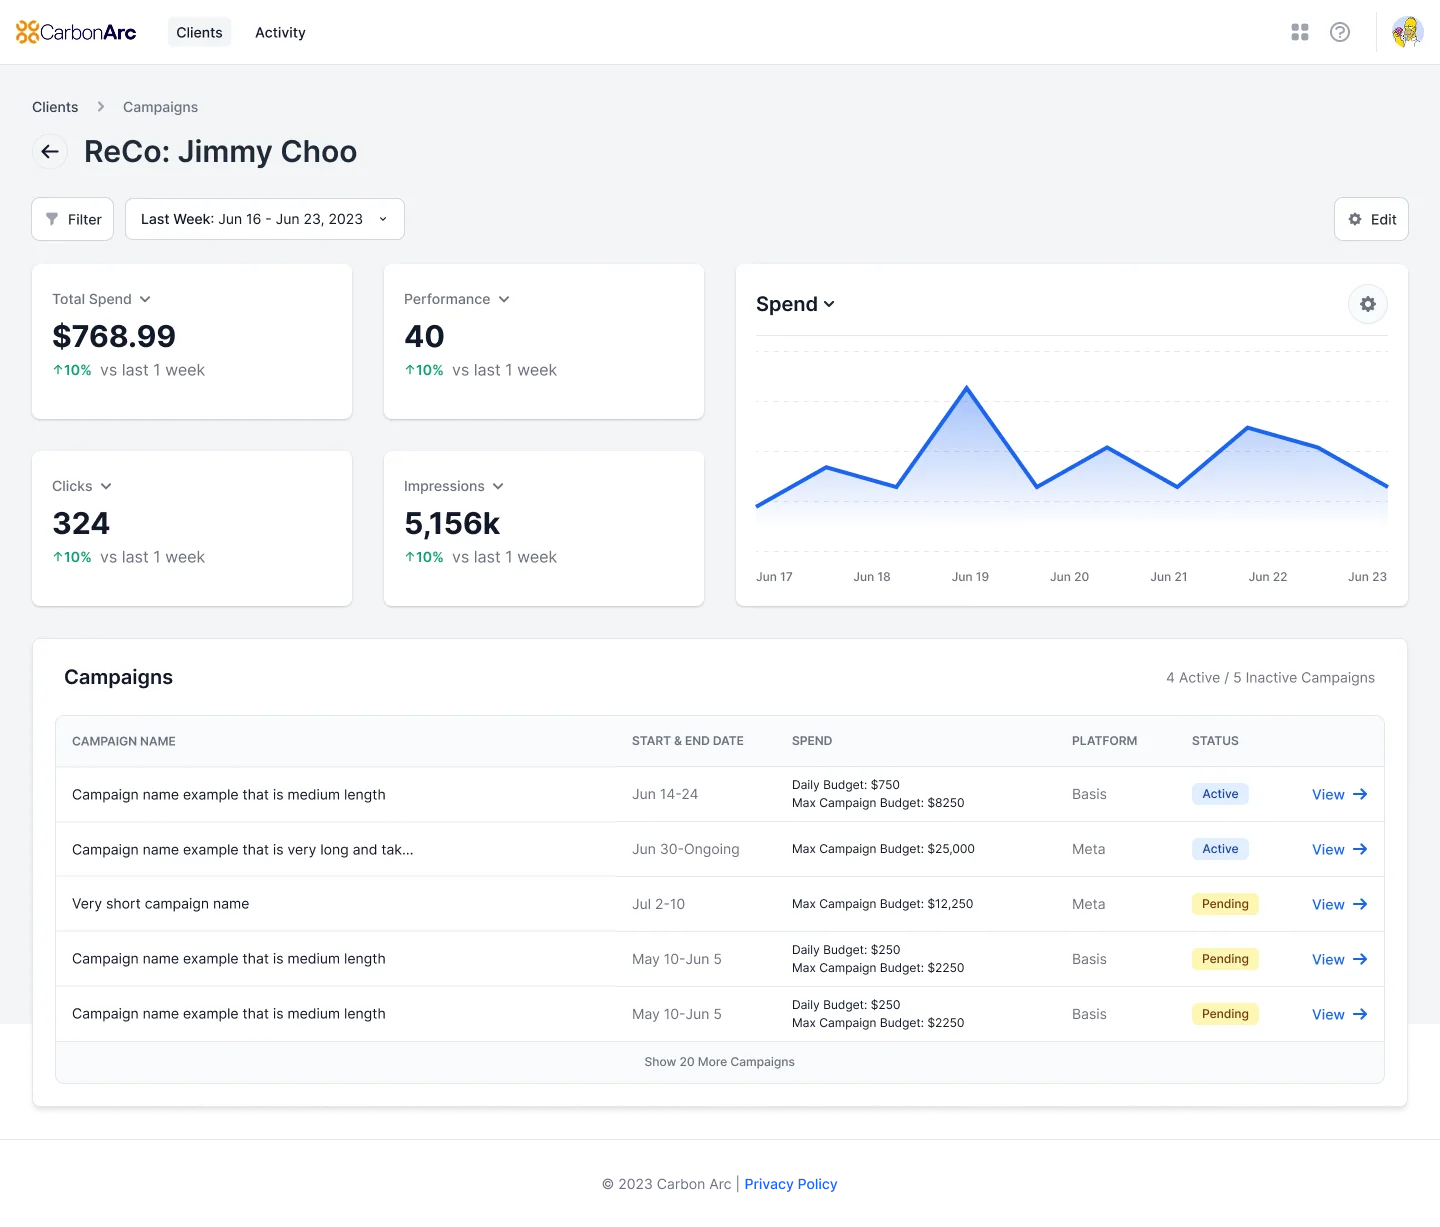
Large clients needed to use Carbon Arc’s audience data across platforms with different rules. I helped shape a portal that brought spend, performance and campaign status together while preserving each platform’s requirements.
Keep the signal useful on mobile
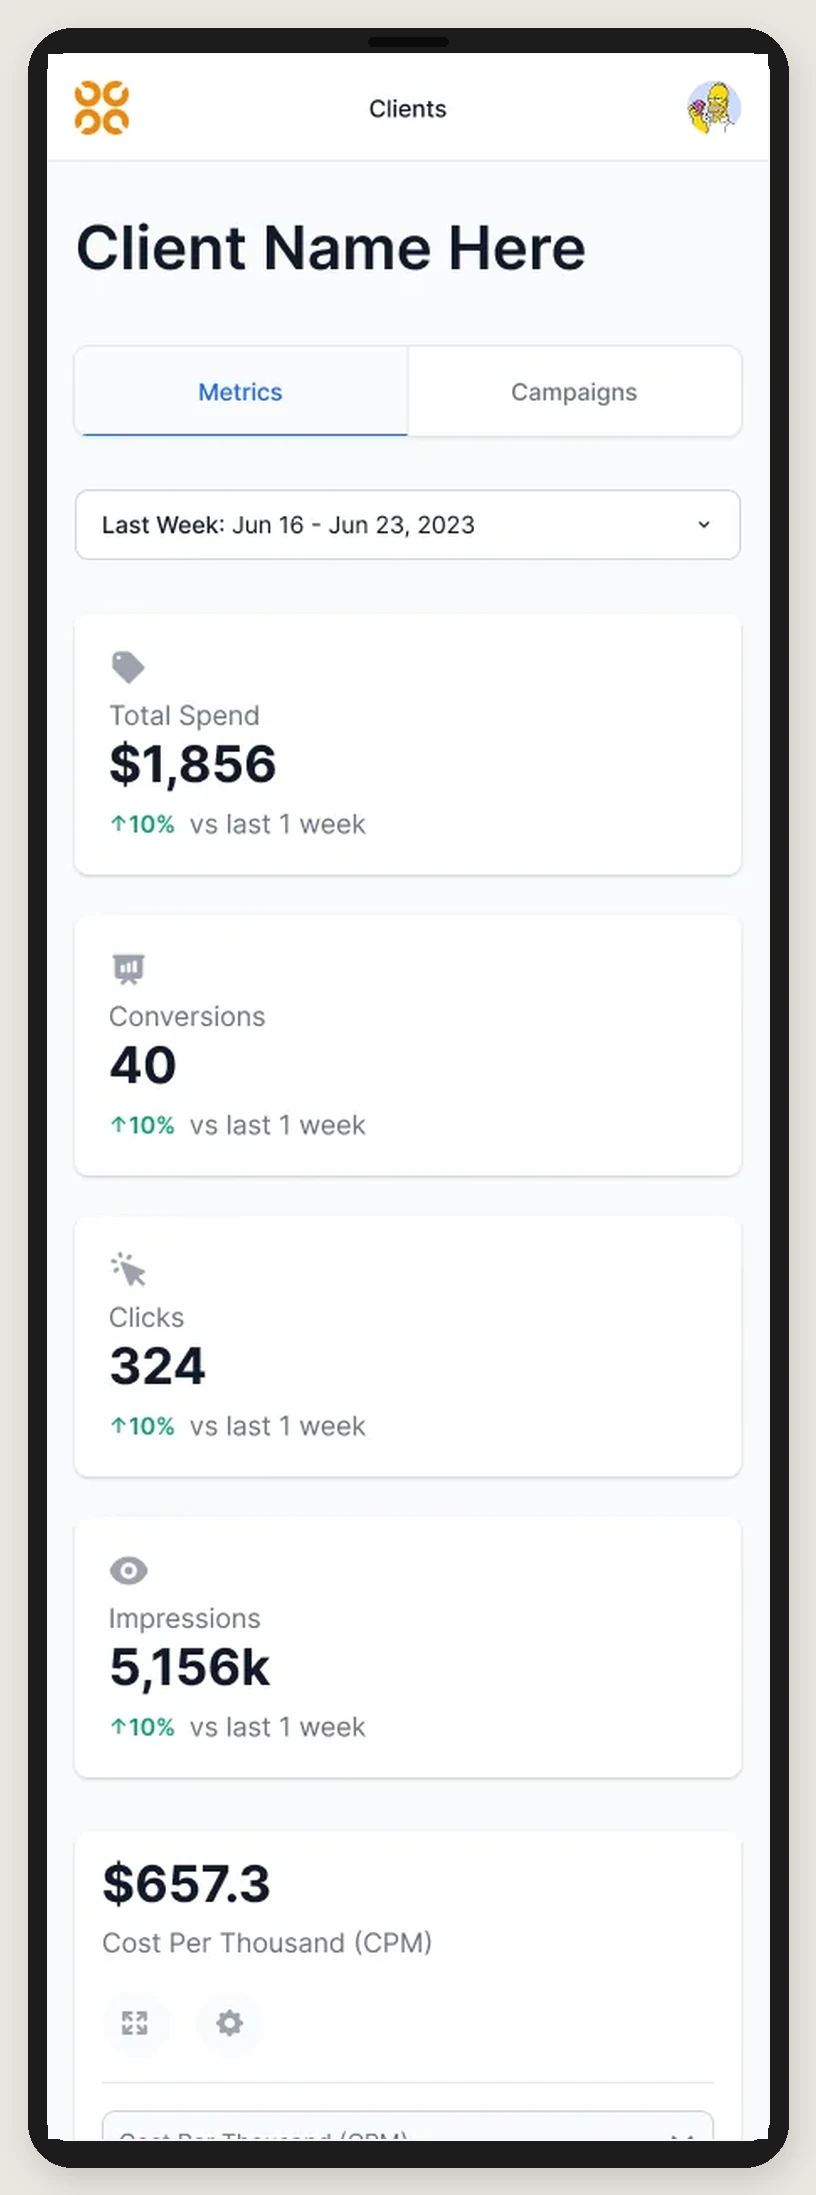
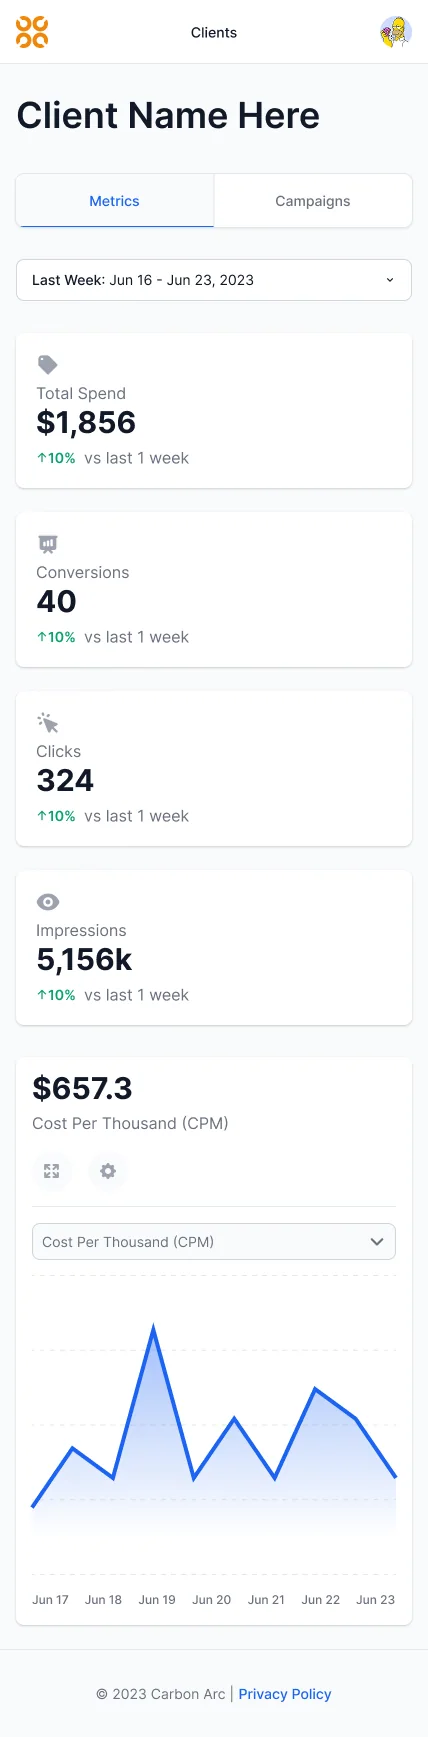
The mobile layout puts the date range above a stack of metrics, with change from the previous week beside each value. A separate chart shows how the selected metric changed over time.
From data to delivery
I shaped screens and managed teams through delivery. I also helped build the ingestion, transformation and ontology pipeline that made Carbon Arc data usable in campaign workflows.
The tools reached roughly 100 to 500 users at large clients, including major music-industry organizations.